CLion Debugging
This guide will help with setting up CLion for remote debugging through dcload's GDB feature.
Setup
The following criteria must be met before following this guide:
- The specific project must be setup within CLion
- A working version of dcload-ip or dcload-serial must be available on the host system
- The target Dreamcast will need either a Broadband adapter, LAN adapter, or a Coder's cable (USB or serial cable) connected
Creating a debug configuration
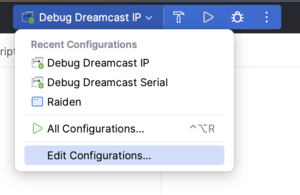
After opening your project in CLion, click the dropdown for the current debug/run configuration and select "Edit Configurations...":
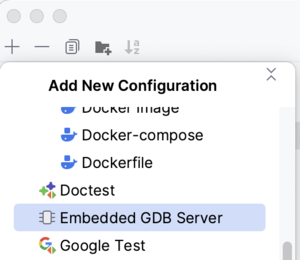
In the configuration editor window, select the + icon to create a new configuration and select "Embedded GDB Debugger":
Embedded GDB Server Settings
Now that the new configuration has been created, the specific settings can now be populated to enable debugging sessions.
Use the following settings in the debug configuration page:
- Name: Dreamcast Debug IP/Serial (really, it's up to the user)
- Target: Your project
- Executable binary: Your executable for your project
- GDB: Bundled GDB (This can handle SH-4 executables)
- Download Executable: Never
- 'target remote' args: localhost:2159 (default port for dcload's GDB instance)
- GDB Server: /path/to/dc-tool-[ip|serial]
- GDB Server args: -g -x $CMakeCurrentBuildDir$/<your executable name>.elf -c $ContentRoot$ -t <IP address or /dev/tty device>
- -g: Starts dcload with GDB
- -x: Uploads and executes your binary
- -c: Points dcload to your project directory to be able to load files with "/pc/" (requires superuser)
- -t: The device dcload should target
- Advanced GDB Server Options
- Run with root privileges: Checked
Once all settings have been configured, click "Apply" and the configuration should be ready.
Using the Debugger
Now that the Embedded GDB Server has been configured, the executable can be launched. To launch a binary on the Dreamcast, make sure it is powered on and dcload-ip/serial has been booted and connected to the computer. Once the Dreamcast is ready to receive a new binary, click on the "bug" icon in the toolbar of CLion:
This will compile any changes and generate a new .elf file and launch dc-tool-[ip/ser] with the correct flags. The desired binary should be deployed to and launched on the Dreamcast at this point. The dc-tool-* binary should now be waiting for a GDB connection. CLion will launch GDB and connect to the waiting GDB server. Once CLion connects, a debug session will be started in the CLion user interface. Below are some of the features supported by CLion's debugger:
Breakpoints
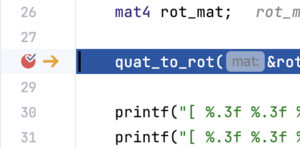
To set a breakpoint, hover over a line number within a file and a small red circle will appear. The breakpoint can be enabled or disabled by clicking the red circle:
Stdout capturing
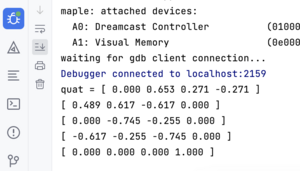
The debug view within can show the output of dc-tool:
Memory viewer
CLion can take a memory location as an input and display the data at that point in memory:
Display type data on hover
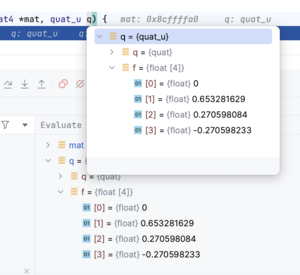
While debugging in a breakpoint, the user can hover over variables within a method to display their contents:
View pointers as arrays
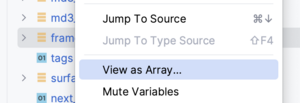
Pointers can be displayed as arrays by right-clicking on the specific variable in the variable viewer and selecting "View as Array...":
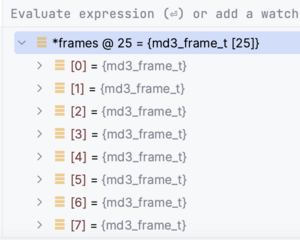
The user interface will ask for the size of the array. Once the size has been input, CLion will display the variable as an array of that type:
